


Yes—you can sync ClickUp to Microsoft Excel by exporting ClickUp task data into an Excel-friendly file (CSV/XLSX) or by using an integration that keeps Excel updated, so project managers and analysts can report, analyze, and share progress without rebuilding spreadsheets from scratch.
Next, you’ll see the practical difference between a one-time export and an automated workflow, including the most reliable ways to keep ClickUp data current in Excel for weekly status reports, KPI tracking, and stakeholder dashboards.
Then, we’ll cover when a two-way ClickUp ↔ Excel setup makes sense, how to prevent “dueling edits,” and how to pick a clear source of truth so updates don’t overwrite the wrong field.
Introduce a new idea: once your workflow is chosen, the real win comes from consistent field mapping, stable row identity, and troubleshooting the common issues that make exported sheets messy or unreliable.
What does “sync ClickUp to Microsoft Excel” mean for project managers and analysts?
“Sync ClickUp to Microsoft Excel” is a workflow that moves ClickUp task and view data into Excel for reporting and analysis, either as a one-time export (snapshot) or as an automated refresh, with the standout goal of turning tasks into structured spreadsheet rows.
To better understand what you’re building, it helps to separate the intent (reporting in Excel) from the mechanism (export vs integration), because each path changes how often you refresh, how you handle edits, and how you prevent data drift between tools.

For project managers, “sync” usually means: “I want ClickUp tasks to become an Excel report that I can filter, pivot, and share.” For analysts, “sync” often means: “I want a stable dataset in Excel that refreshes reliably so my metrics and charts don’t break.” Those two goals overlap, but the success criteria differ:
- PM success criteria: fast reporting, clear status visibility, stakeholder-friendly exports, consistent weekly cadence.
- Analyst success criteria: stable columns, consistent data types, repeatable refresh, minimal manual cleanup, traceable IDs.
Before you pick a method, align on what “Excel” actually represents in your workflow. In many teams, Excel is not just a file—it’s the “presentation layer” for leadership and the “calculation layer” for metrics. That’s why your ClickUp-to-Excel approach should be designed like a pipeline: define the source view, define the fields, define the refresh, and define who edits what.
This table contains the three most common interpretations of “sync ClickUp to Excel,” so you can choose the method that matches your reporting cadence and governance needs.
| Approach | Best for | Refresh style | Edit behavior |
|---|---|---|---|
| Manual export (CSV/XLSX) | Weekly snapshots, ad-hoc reporting | On demand | Edit in Excel without expecting ClickUp to change |
| Automated one-way sync (ClickUp → Excel) | Dashboards, recurring reports | Scheduled or near real-time | Excel is read-mostly; edits happen in ClickUp |
| Two-way sync (ClickUp ↔ Excel) | Distributed updates, data entry teams | Scheduled or event-driven | Edits can flow both directions with conflict rules |
Is exporting ClickUp to Excel the same as syncing ClickUp with Excel?
No—exporting ClickUp to Excel is a snapshot of your ClickUp data at a point in time, while syncing ClickUp with Excel is an ongoing connection that updates your Excel dataset on a schedule or trigger, which is why syncing is better for recurring reporting and exporting is better for one-off sharing.
However, the confusion happens because both actions produce a spreadsheet. The difference shows up the next day: if a task changes status in ClickUp, a static export won’t reflect it unless you export again, while a sync can refresh the dataset and keep charts aligned.
In practice, exporting is best when:
- You need a clean deliverable for a meeting, audit, or client.
- You want to archive a milestone snapshot (“end of sprint,” “end of month”).
- You do not want Excel edits to influence ClickUp tasks.
Syncing is best when:
- You publish the same report every week and want consistent numbers.
- You need a stable dataset for pivots, charts, and KPI dashboards.
- You want to eliminate repeated exports and cleanup work.
Who should use ClickUp → Excel workflows (and who shouldn’t)?
There are 4 main groups who benefit from ClickUp → Excel workflows—project managers, operations leads, analysts, and client-facing teams—based on how often they report, how standardized their metrics are, and how many stakeholders need spreadsheet access.
Specifically, ClickUp-to-Excel is a strong fit when Excel is your reporting standard and leadership expects filters, pivots, and printable summaries.
Use ClickUp → Excel if you are:
- A project manager who sends weekly status updates and needs consistent rollups.
- An operations lead who tracks throughput, backlog health, or SLA performance.
- An analyst who maintains KPIs, trend charts, and standardized dashboards.
- A client-facing team that must share progress in a familiar spreadsheet format.
Don’t force ClickUp → Excel if you are:
- A team that needs real-time collaboration inside ClickUp and rarely uses Excel outputs.
- A workflow that depends heavily on ClickUp-only constructs (complex relationships, dependencies, or embedded docs) and expects Excel to mirror them perfectly.
- A scenario where Excel becomes the “shadow system” and people stop updating ClickUp—this causes drift and accountability issues.
Can you export ClickUp tasks and views to an Excel-friendly file without integrations?
Yes—you can export ClickUp tasks and views to an Excel-friendly file without integrations by exporting List or Table views as CSV (and then opening in Excel), which is the fastest method for creating a reporting snapshot with minimal setup.
Next, the key is to export from a view that already represents your reporting logic—because the export will inherit your visible columns, filters, and grouping behavior, which determines how much cleanup you’ll do in Excel.

Think of native export as a “controlled extract.” You decide what the dataset looks like by designing the ClickUp view first. That’s why the best workflow is:
- Design the source view (List or Table) with the right filters and columns.
- Export the view as CSV/Excel-friendly output.
- Open in Excel, apply a stable template (pivots, charts, formatting).
If your reporting needs are weekly or monthly, manual export can be “good enough” and far safer than a complex integration—especially when you need a human-reviewed snapshot before sending it to stakeholders.
How do you export a ClickUp List or Table view to CSV/Excel format?
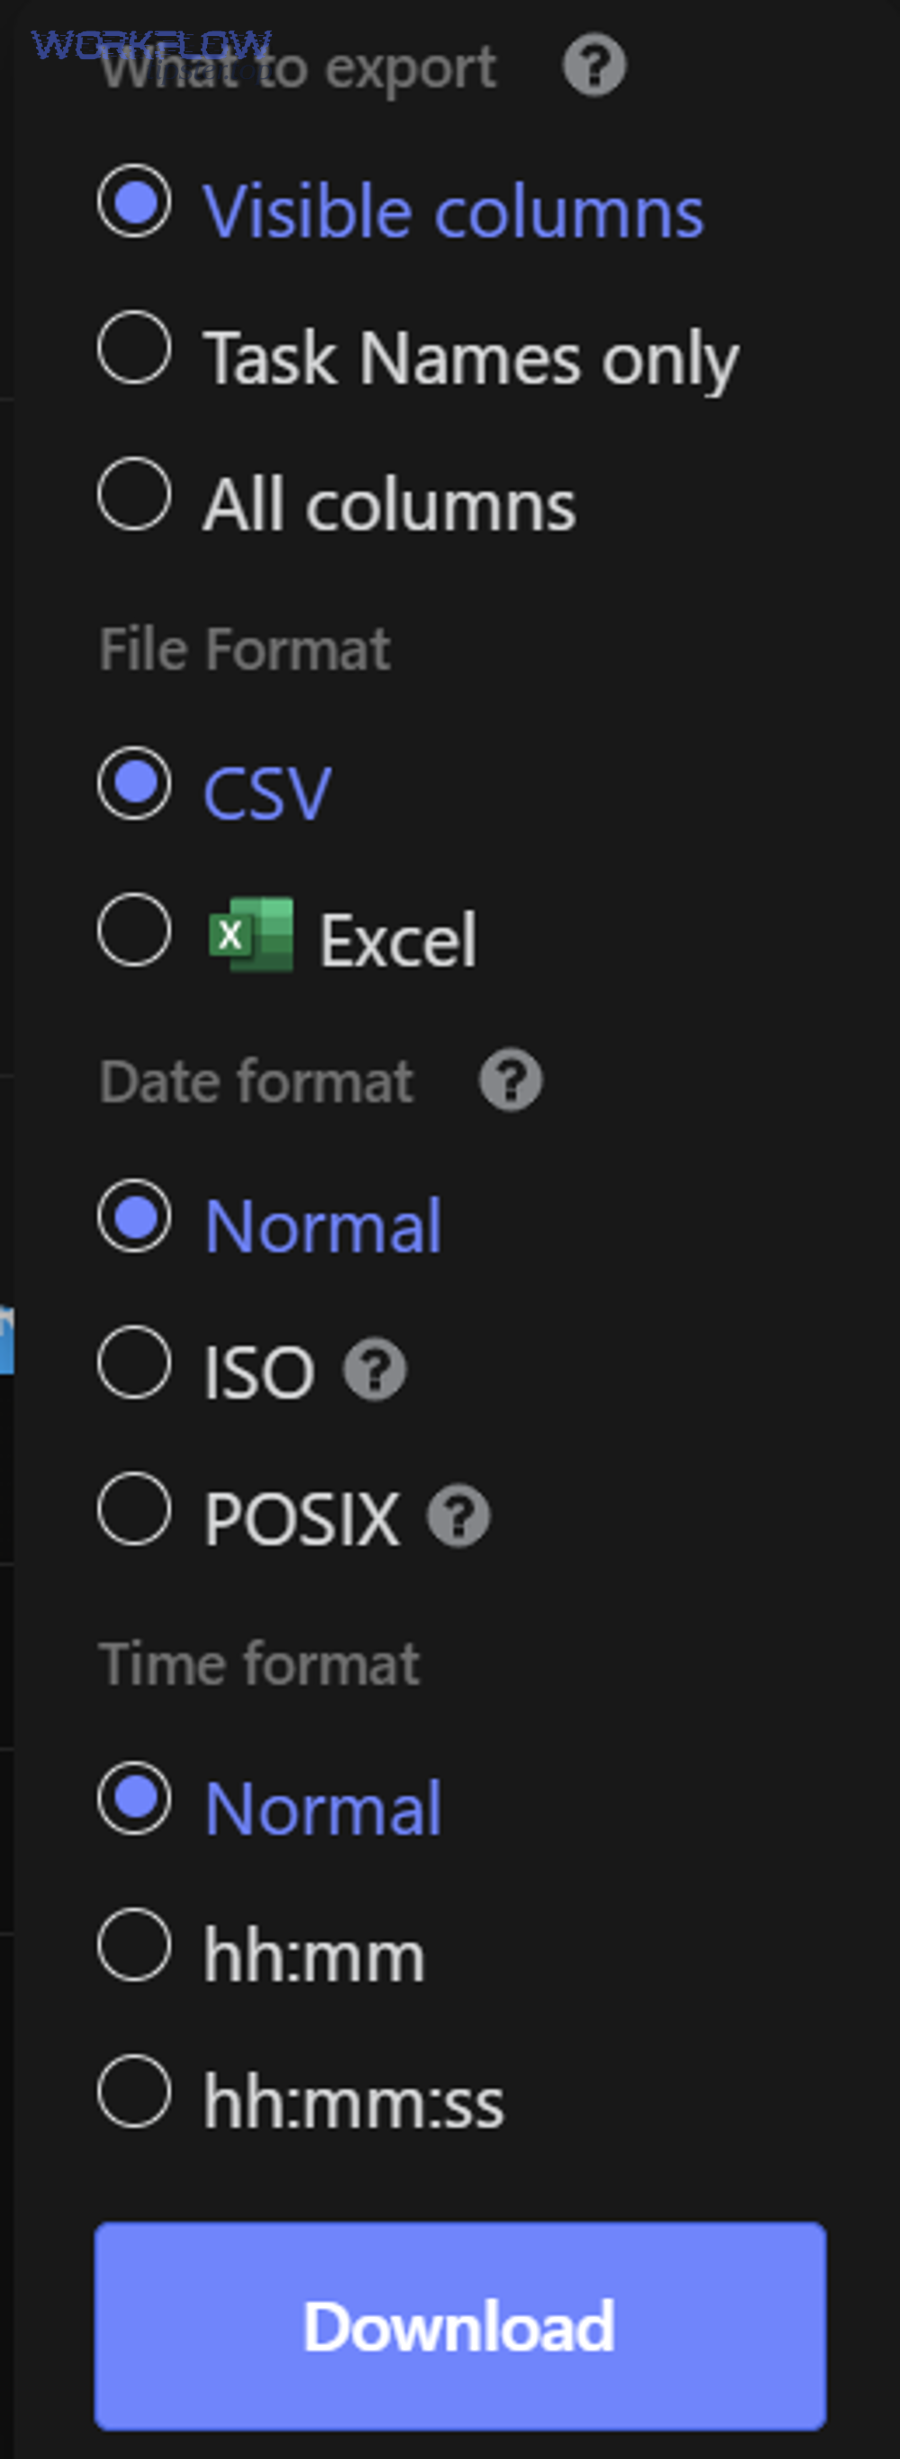
Exporting a ClickUp List or Table view to CSV/Excel format is a simple 5-step method—prepare the view, verify visible columns, export the view, download the file, and open it in Excel—so you get a spreadsheet-ready dataset for reporting in minutes.
To begin, set up the view as if it were already a report, because the export is only as clean as the view you export.
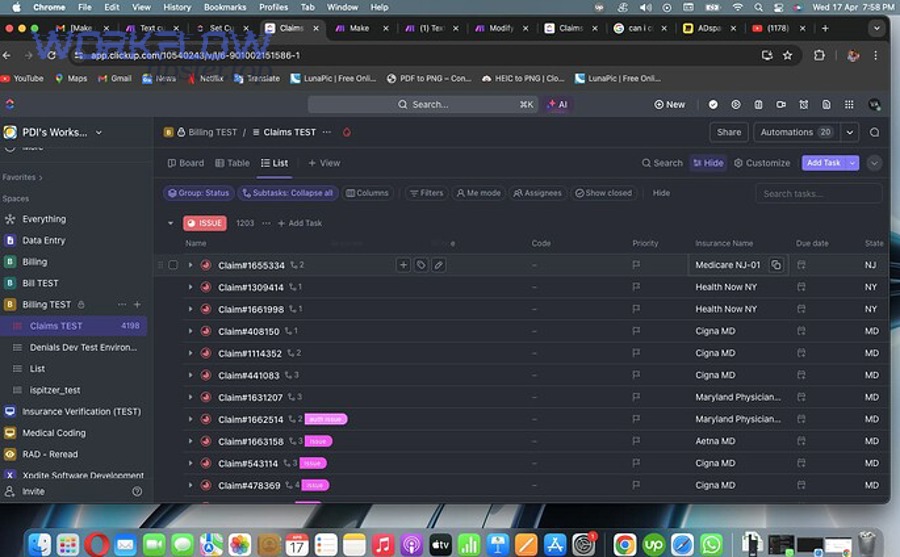
- Step 1: Open the List or Table view that represents the tasks you want in Excel.
- Step 2: Apply your reporting filters (e.g., “This week,” “In Progress,” “Assignee is not empty”).
- Step 3: Choose which columns should be visible (status, assignee, due date, priority, custom fields).
- Step 4: Use the view export option to export as CSV (Excel-friendly).
- Step 5: Open the CSV in Excel and convert it into a Table so pivots/charts stay stable.
If you want a visual walkthrough, this video demonstrates exporting ClickUp lists to CSV/Excel without needing extra tools:
A practical tip for PMs: export from a “Reporting View” you keep in ClickUp (for example, “Weekly Status—Leadership”). When the view stays consistent, Excel stays consistent, and your report becomes repeatable.
What data is included (and not included) when exporting ClickUp to CSV?
There are 3 main buckets of ClickUp data behavior when exporting to CSV: core task fields that export cleanly, view-shaped fields that depend on your columns/filters, and ClickUp-native objects that may not export as you expect—based on how spreadsheets represent structured data.
More specifically, understanding these buckets prevents the most common disappointment: expecting a CSV to behave like a full ClickUp mirror.
Usually included (exports cleanly):
- Task name/title, status, assignee(s), due dates, priorities
- List/space/folder context (depending on export settings and view)
- Custom fields (especially text, number, dropdown, date) when included as columns
- Tags and simple metadata (often as comma-separated values)
Depends on your view configuration:
- Which columns appear (if it’s not visible, it may not export the way you need)
- Which tasks appear (filters determine your dataset scope)
- Grouping behavior (collapsed groups may not export as you expect)
Commonly tricky or limited (may require modeling in Excel):
- Task relationships and dependencies (often flattened or partially represented)
- Comments, activity logs, and rich content (may be omitted or simplified)
- Attachments (often represented as references rather than embedded files)
- Complex formulas/rollups (may not translate into spreadsheet-native logic)
Evidence matters here because spreadsheet workflows are error-prone when columns and formats drift. According to a study by the University of Wisconsin–Madison from the Department of Biostatistics & Medical Informatics, in 2017, the authors noted that Panko’s audits of real-world spreadsheets reported an average of 88% contained errors—reinforcing why consistent export structure and validation are essential.
What are the best ways to automate ClickUp → Excel updates for reporting?
There are 3 main ways to automate ClickUp → Excel updates—scheduled manual exports, no-code connectors, and data pipelines—based on your refresh frequency, the complexity of your field mapping, and how much governance your reports require.
Next, the best method is the one that reduces recurring work without creating a fragile system that breaks whenever your view changes or a custom field gets renamed.

To choose correctly, use a simple decision lens:
- Refresh cadence: weekly, daily, hourly, or near real-time?
- Data stability: do you need stable IDs and dedupe rules?
- Governance: who owns the mapping and who can change the dataset schema?
This is also the section where many teams start exploring Automation Integrations—not just to push data into Excel, but to standardize reporting across multiple apps and keep stakeholders aligned.
Which automation options exist (scheduled export, connector, data pipeline), and when should you choose each?
Export wins for simplicity, connectors win for speed-to-automation, and pipelines win for reliability at scale—so the best choice depends on whether you prioritize low setup, recurring refresh, or enterprise-grade control over mapping and refresh logic.
However, picking the wrong level of automation is expensive: too little automation wastes time every week, while too much automation creates a brittle “black box” that nobody can fix.
Option A: Scheduled manual export (light automation)
- Choose this when: you report weekly/monthly and want a human-checked snapshot.
- Strength: minimal complexity; you control exactly what you send out.
- Risk: repeated work; easy to forget; formatting drift if you don’t use a template.
Option B: No-code connector (operational automation)
- Choose this when: you need scheduled refresh and consistent datasets for dashboards.
- Strength: fast setup; can run on a schedule; reduces manual exports.
- Risk: mapping can be limited; rate limits and schema changes can break refreshes.
Option C: Data pipeline (analyst-grade automation)
- Choose this when: you need stable IDs, dedupe logic, incremental loads, and strong governance.
- Strength: highest reliability and control; best for large workspaces and complex reporting.
- Risk: requires more setup and maintenance; may need technical ownership.
As you evaluate connectors, it helps to recognize common “integration families.” If you’ve built workflows like convertkit to zoho crm or airtable to activecampaign, you’re already familiar with the same core concepts: field mapping, refresh cadence, dedupe rules, and error handling.
Can you schedule ClickUp data to refresh in Excel automatically?
Yes—you can schedule ClickUp data to refresh in Excel automatically if you use a connector or pipeline that runs on a schedule, because Excel alone does not “pull” ClickUp updates by default without a configured refresh mechanism.
Moreover, “automatic” can mean two different things, and your choice affects reliability:
- Push model: an automation sends updated rows into a dataset that Excel reads (great for recurring dashboards).
- Pull model: Excel refreshes from a data source (great for analyst control and reproducibility).
For most PM reporting, a push model is enough: it keeps leadership dashboards current without asking anyone to remember exports. For analyst workflows, a pull model is often better: it supports repeatable refresh, stable transformations, and auditability.
How do you set up a two-way ClickUp ↔ Excel integration without breaking your workflow?
Set up a two-way ClickUp ↔ Excel integration by defining a single source-of-truth rule, mapping only the fields that truly need bidirectional edits, and adding conflict resolution logic—so updates flow safely without overwriting statuses, dates, or owners.
Then, treat two-way sync as a controlled editing system, not a convenience feature, because the biggest risk is silent overwrite: one tool “wins” and you only notice after your report looks wrong.

Two-way sync is tempting when teams already live in Excel. But without rules, it creates a “shadow process” where tasks get edited outside ClickUp and accountability becomes unclear. The solution is to narrow the scope:
- Sync only the fields that Excel users must change (e.g., forecast date, estimated hours, notes).
- Keep authoritative task execution fields in ClickUp (e.g., status transitions, assignees, priority rules).
- Use task IDs as stable keys so updates map to the correct row and the correct task.
When is two-way sync worth it compared to one-way export?
Two-way sync is worth it when Excel users must update a defined subset of task fields regularly, one-way export is better when ClickUp is the execution system and Excel is only for reporting, and manual export is optimal when you need a reviewed snapshot for stakeholders.
Meanwhile, here is a practical “worth it” checklist—if you answer “yes” to most of these, two-way sync can pay off:
- Yes: A data-entry team updates fields in spreadsheets daily (forecasts, estimates, categorization).
- Yes: Updates must reflect back in ClickUp without copy/paste.
- Yes: You can enforce a stable schema and prevent random column renames.
- Yes: You can define who edits what (field ownership) and how conflicts resolve.
If your main need is leadership reporting, two-way sync is usually unnecessary risk. One-way sync gives you the dashboard benefits without allowing Excel to accidentally rewrite the operational truth in ClickUp.
What should be the “source of truth”: ClickUp or Excel?
ClickUp should be the source of truth for task execution (status, ownership, priority), while Excel should be the source of truth for analysis and presentation (metrics, pivots, reporting views), unless you intentionally designate a limited set of fields for Excel-based updates.
In addition, a source-of-truth model becomes real only when you write it down as rules and build your sync around them.
A strong source-of-truth policy looks like this:
- ClickUp owns: status, assignee, task name, workflow stages, completion dates.
- Excel owns (optional): forecast date, cost code, report grouping label, analyst notes.
- Shared fields (use caution): due date, effort estimates—only if you set conflict rules.
To prevent breakage, treat Excel edits as “requests” unless you truly need them to be authoritative. This mindset keeps ClickUp clean and prevents accidental overwrites when someone pastes values across dozens of rows.
How do you map ClickUp fields to Excel columns so reports stay consistent?
Map ClickUp fields to Excel columns by standardizing your column schema, exporting from a stable reporting view, and using task IDs as primary keys—so your Excel tables, pivots, and charts stay consistent even when tasks change.
Specifically, field mapping is less about exporting “more data” and more about exporting “the right data in the right shape,” because reporting breaks when columns drift or data types flip between text and dates.
Start with a reporting schema that matches how you report. For most teams, that means a “task-level fact table” (one row per task) plus optional lookup tables (statuses, people, teams). Even if you never build separate tables, thinking this way helps you keep columns stable.
Core mapping principles that reduce cleanup:
- Use stable keys: export a task ID column and keep it—even if you hide it in final reports.
- Keep one row per task: avoid exporting layouts that create repeated header sections.
- Normalize multi-value fields: tags/multi-selects should be consistent (delimited) or separated.
- Freeze column names: rename columns once in a template and keep them consistent over time.
Which ClickUp fields should you export for KPI dashboards and weekly reports?
There are 2 practical export sets for KPI dashboards and weekly reports: a “minimum viable reporting” set for consistent rollups and a “deep-dive” set for root-cause analysis—based on how detailed your stakeholder questions usually get.
To illustrate, start with the smallest set that answers 80% of questions, then add fields only when you can defend why they belong in the report.
Minimum viable reporting (most teams):
- Task ID (primary key)
- Task name
- Status
- Assignee
- Due date (and/or start date)
- Priority
- List/Folder/Space (context)
- Last updated date (if available) for freshness checks
Deep-dive KPI reporting (ops and analytics):
- Created date and completed date (cycle time / throughput)
- Time estimates and time tracked (capacity and burn)
- Custom fields for cost center, client, project phase, sprint, severity
- Tags or labels used for segmentation
- Owner team / department (if modeled)
For PMs, the KPI set should answer: “What’s blocked? What’s late? What shipped this week?” For analysts, it should answer: “What changed? What drives the trend? Can I segment by team/client?”
How do you handle custom fields, multi-selects, and statuses in Excel without messy data?
Handle custom fields, multi-selects, and statuses in Excel by enforcing consistent value rules, using lookup tables for categories, and converting multi-value fields into either delimited text or separate tables—so pivots and filters stay accurate.
More importantly, messy data usually comes from inconsistent encoding, not from “too much information,” so the fix is to standardize how values appear in exports.
Custom fields (best practices):
- Dropdowns: keep a fixed set of allowed values; avoid “Other” values that multiply over time.
- Numbers: store as numbers (not “10 hrs” text); apply units in Excel formatting instead.
- Dates: standardize date formats and confirm timezone expectations for due dates and completion dates.
Multi-selects and tags (two clean modeling options):
- Option 1 (simple): keep as delimited text (e.g., “Client A; Urgent; Backend”) for light filtering.
- Option 2 (robust): create a separate “TaskTags” table with TaskID + Tag for accurate pivots.
Statuses (avoid pivot chaos):
- Use a stable “Status Group” column (To Do / Doing / Done) to standardize rollups.
- Keep the detailed status name for workflow nuance, but roll up with the group for reporting consistency.
What are the common problems when exporting or syncing ClickUp to Excel, and how do you fix them?
There are 6 common problems when exporting or syncing ClickUp to Excel—wrong date formats, missing columns, duplicates, broken grouping, permission/export limits, and schema drift—and each is fixable by stabilizing your view, using task IDs, and applying a repeatable Excel import template.
Next, the fastest way to troubleshoot is to isolate whether the problem starts in ClickUp (view/schema) or in Excel (import/formatting), because fixing the wrong layer wastes time and keeps the issue recurring.

Problem 1: Dates look wrong (or shift by a day)
Excel can interpret CSV dates inconsistently depending on locale settings. The fix is to import using a controlled data type (date) and standardize on an ISO-like date format in your workflow. If you refresh the dataset, keep the same import method so Excel doesn’t reinterpret the column differently each time.
Problem 2: Columns disappear or show up unexpectedly
This often happens when exports depend on “visible columns” or when the source view changes. The fix is to lock a dedicated reporting view in ClickUp and treat it as part of your reporting system, not a casual working view.
Problem 3: Duplicates appear after refresh
Duplicates typically appear when your refresh appends rows instead of updating existing rows. The fix is to set a stable primary key (Task ID) and configure the workflow to “update matching rows” rather than “append all.”
Problem 4: Grouping collapses or the export looks reorganized
Some exports exclude collapsed groups or behave differently depending on view settings. The fix is to export from a consistent state (expanded) and avoid relying on layout artifacts for downstream reporting.
Problem 5: Export limits or permission issues
If your plan or role limits exporting frequency, you may hit a ceiling during heavy reporting periods. The fix is to centralize export ownership (one reporting owner), reduce export frequency with a stable template, or use an automation method designed for scheduled refresh.
Problem 6: Schema drift breaks pivots and charts
Schema drift occurs when column names change, new columns appear, or data types change. The fix is to use an Excel template that expects a stable column set and to add new columns intentionally—never casually.
Why does the exported file look “wrong” (dates, formatting, columns), and what’s the fastest fix?
The exported file looks “wrong” because Excel guesses formats during import and because your exported view shape may differ from your reporting expectations, so the fastest fix is to re-import using a controlled data type mapping and to export from a dedicated reporting view with stable visible columns.
In short, “wrong-looking” exports are rarely a ClickUp problem alone; they are usually an import interpretation problem.
Fastest fixes checklist:
- Import the CSV using Excel’s import wizard (or equivalent) and set the date column type explicitly.
- Convert the imported range into an Excel Table so formulas, pivots, and charts reference structured columns.
- Verify the ClickUp view: confirm filters, visible columns, and grouping state before exporting again.
- Apply a consistent template (same column names, same order) every time you refresh.
How do you prevent duplicates and keep a stable row identity across refreshes?
Prevent duplicates and keep stable row identity by using Task ID as a primary key, configuring refresh logic to update matching rows (not append), and creating a dedupe rule that flags duplicate Task IDs—so each task stays one row even across repeated refresh cycles.
Besides, stable identity is what turns your dataset into a system rather than a one-off spreadsheet.
Practical implementation in Excel:
- Keep Task ID: even if you hide it in final stakeholder views, keep it in your dataset table.
- Create a duplicate check: use conditional formatting or a COUNTIF check on Task ID.
- Separate raw from report: keep a “Raw_Import” sheet and a “Report” sheet so refreshes don’t break formatting.
- Log refresh time: store a refresh timestamp to validate freshness and detect partial runs.
How do you keep ClickUp-to-Excel reporting secure and shareable for stakeholders?
Keep ClickUp-to-Excel reporting secure and shareable by exporting only the necessary fields, using filtered reporting views, applying least-privilege access in ClickUp, and sharing Excel outputs as read-only reports—so stakeholders get visibility without gaining accidental edit power over operational data.
More importantly, secure reporting is not just “who can open the file”; it’s also “what data you included” and “whether Excel became an uncontrolled copy of sensitive task metadata.”
Stakeholder reporting usually has two competing needs:
- High clarity: simple status, due dates, ownership, and blockers.
- Low exposure: no internal notes, sensitive client details, or employee performance signals unless required.
The clean solution is to create a purpose-built reporting view in ClickUp and export only from that view. Treat the view as a “data contract” between ClickUp and Excel: it defines exactly what stakeholders are allowed to see.
Shareability tactics that keep reports stable:
- Use a single Excel report template and refresh into it, rather than creating a new file each week.
- Separate “raw dataset” tabs from “stakeholder view” tabs.
- Lock formulas and formatting in the stakeholder view to prevent accidental edits.
- Keep a small “Definitions” section (metrics definitions, status meaning) so the report reads clearly.
Should you export everything or only filtered/sanitized views for Excel reporting?
No—you should not export everything for Excel reporting; you should export a filtered/sanitized view because it reduces data leakage risk, lowers cleanup time, and improves stakeholder clarity by focusing only on the fields that answer reporting questions.
Especially in larger organizations, exporting everything becomes a security and governance problem: a single file can expose internal notes, sensitive tags, or custom fields that were never meant for broad distribution.
Three reasons filtered exports win:
- Less risk: you avoid leaking internal notes or sensitive custom fields.
- More clarity: stakeholders see only what they need (status, owner, due date, blockers).
- More consistency: your report schema stays stable because you control the column set.
As a best practice, treat stakeholder-facing Excel as “read-only reporting,” and keep task editing and operational truth inside ClickUp unless you intentionally designed a controlled two-way sync.
Contextual Border: Up to this point, you’ve built a complete ClickUp → Excel workflow that answers the primary intent: export or sync tasks into Excel, automate refresh where needed, map fields, troubleshoot issues, and share reports securely. Next, we expand into advanced setups and edge cases that deepen micro semantics—useful when scale, reliability, or uncommon data types become the priority.
What advanced ClickUp ↔ Excel setups improve reliability, scale, and edge-case handling?
Advanced ClickUp ↔ Excel setups improve reliability and scale by using controlled pull/push refresh models, modeling rare ClickUp data types into normalized tables, batching large exports, and defining strict conflict resolution for two-way sync—so your reporting pipeline stays stable under real-world complexity.
Next, these advanced patterns matter most when your workspace is large, your stakeholders demand trustworthy metrics, or your data includes relationships and fields that don’t flatten neatly into a single spreadsheet.

Think of these setups as moving from “spreadsheet as a file” to “spreadsheet as a data product.” The goal is not just to get data into Excel—it’s to make refresh repeatable, auditable, and resilient.
How do Power Query-style “pull” models compare to connector “push” models for ClickUp → Excel?
Pull models win in analyst control and reproducibility, push models win in speed and operational simplicity, and the optimal choice depends on whether you need governed transformations (pull) or straightforward scheduled updates (push).
However, both models can be reliable if you treat the dataset schema as a contract and you monitor refresh outcomes.
Pull model strengths (analyst-grade):
- Refresh is initiated from Excel/reporting environment, which supports repeatable runs.
- Transformations can be documented as steps, improving auditability.
- Better fit for standardized KPI pipelines and consistent data types.
Push model strengths (ops-grade):
- Fast setup for scheduled updates and recurring stakeholder reporting.
- Lower friction for PM teams who want automation without heavy modeling.
- Easy to extend into broader Automation Integrations across apps.
If you’ve implemented workflows like asana to airtable, you’ve already seen how push-style integrations can rapidly standardize reporting across tools—while pull-style setups typically offer deeper control when data complexity grows.
What rare ClickUp data types cause reporting issues in Excel (dependencies, relationships, formulas), and how do you model them?
There are 3 rare ClickUp data types that cause the most reporting issues in Excel—dependencies, relationships, and formula-like rollups—because spreadsheets prefer flat tables, so the best approach is to model each complex type into a separate table linked by Task ID.
More specifically, you avoid messy exports by embracing a simple relational pattern inside Excel.
Modeling approach:
- Dependencies table: TaskID, DependsOnTaskID, DependencyType
- Relationships table: TaskID, RelatedTaskID, RelationshipLabel
- Custom rollup outputs: export raw fields, then recompute rollups in Excel pivots or formulas using stable keys
This approach prevents the “one row becomes many rows” problem that destroys pivot stability. You keep the main task dataset clean, then join/lookup details when needed.
How do you handle large workspace exports (performance, pagination, rate limits) without losing data?
Handle large workspace exports by scoping exports to filtered reporting views, batching by time or project segments, using incremental refresh logic, and validating row counts—so your dataset stays complete even when exports must be split across runs.
Besides, scale failures are often silent: the export “finishes,” but you later discover missing rows. The fix is to build simple validation checks into your workflow.
Scale reliability checklist:
- Scope by view: export by list/folder/project rather than “everything.”
- Batch by time: export “Last 30 days” and “Older items” separately if needed.
- Validate row counts: compare expected task count to exported row count.
- Log refresh outcomes: keep a small “Refresh_Log” tab (date, scope, rows, success/fail).
When exports get large, this is also where an analyst-grade pipeline becomes worth it, because it can handle pagination and incremental loads more reliably than repeated manual exports.
How do you design conflict resolution rules for two-way sync to prevent bad overwrites?
Design conflict resolution rules by assigning field ownership, locking execution-critical fields to ClickUp, allowing Excel edits only on approved columns, and defining a clear precedence rule (for example, ClickUp wins on status)—so two-way sync doesn’t overwrite the wrong value.
More importantly, the antonym pair here is the real micro semantic: one-way sync reduces overwrite risk, while two-way sync increases flexibility but requires governance.
Practical conflict resolution framework:
- Rule 1 (field ownership): each field is owned by ClickUp or Excel, never “everyone.”
- Rule 2 (protected fields): status, assignee, priority are protected (ClickUp-only) unless explicitly required.
- Rule 3 (approval gate): high-risk edits (bulk due date changes) require review before syncing back.
- Rule 4 (change visibility): log what changed, when, and by which system.
When teams implement multi-app workflows like airtable to activecampaign or convertkit to zoho crm, the strongest systems always have the same backbone: strict field ownership, predictable updates, and visible error handling. Two-way ClickUp ↔ Excel works the same way—only the objects are tasks and spreadsheet rows.